Dashboard
The dashboard provides an overview of your nodes and graphs at a glance. You can navigate to the dashboard through the navigation bar at the top of the screen after you log in.
Features of this include:
- Resizable containers
- Active node filters
- Attribute filters
- Google map
Widgets
Summary
The Summary widget provides a numerical overview of all node properties.
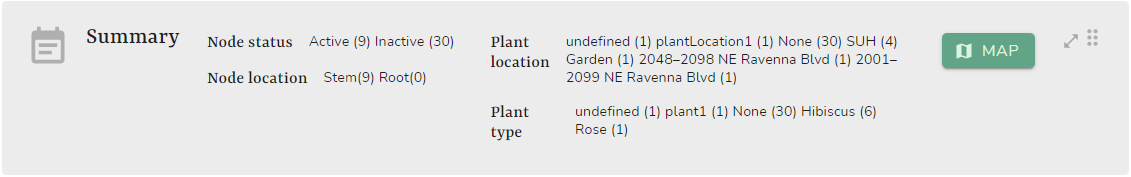
Information shown includes:
- Node status: Displays the number of active or inactive nodes.
- Plant location: Displays the number of nodes in each plant location.
- Node location: Displays the number of nodes in each node location.
- Plant type: Displays the number of nodes with each plant type.
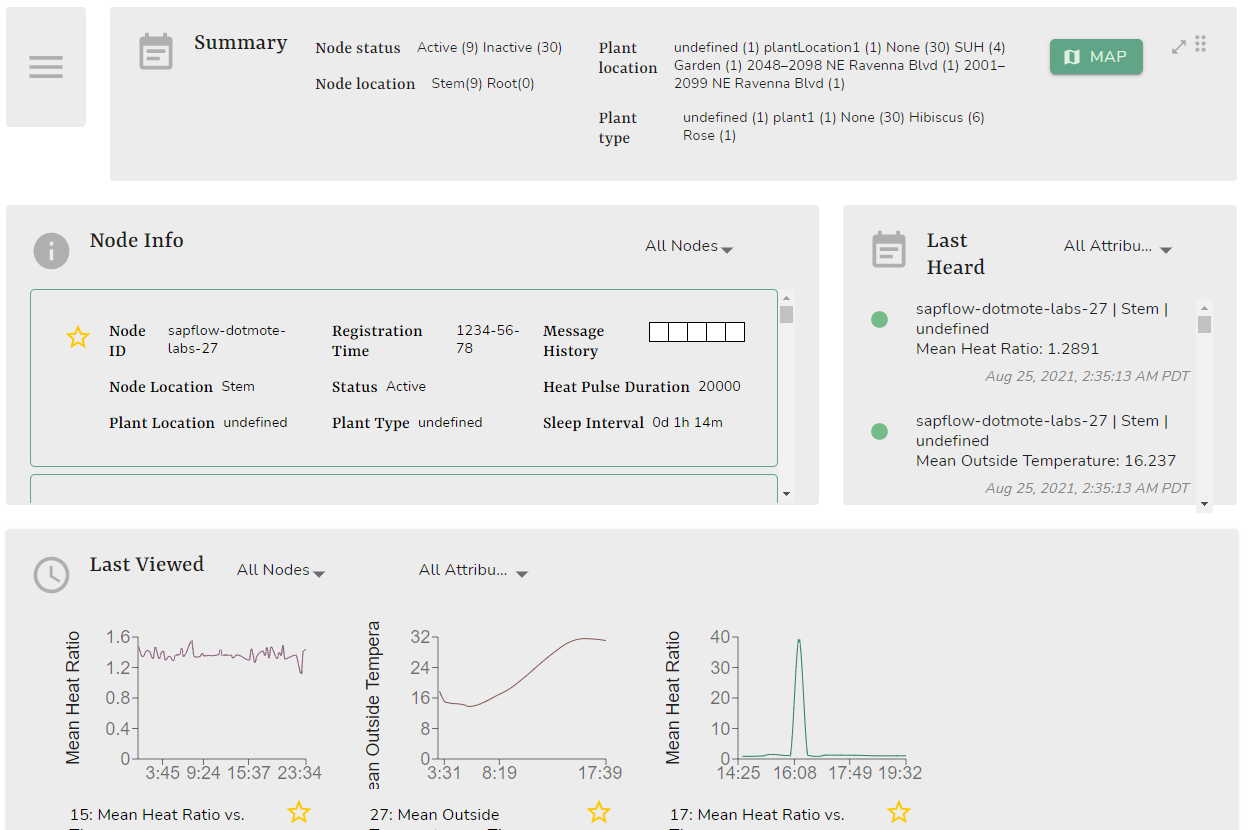
Node Info
The Node Info widget provides an overview of individual node info. Clicking on any node will direct you to the details page of that node.
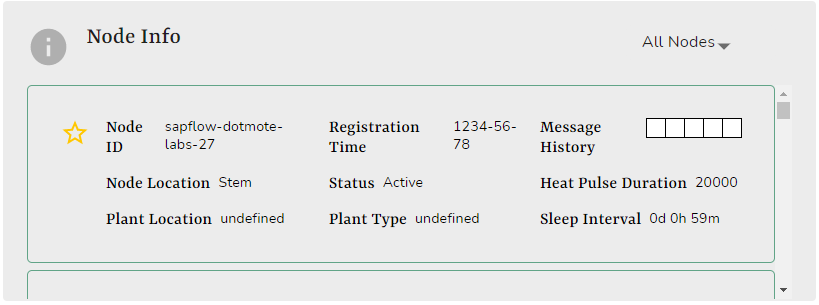
Information shown includes:
- Node ID
- Registration time
- Message history
- Node location
- Status
- Heat pulse duration
- Plant location
- Plant type
- Sleep interval
Last Heard
The Last Heard widget provides the last heard values of attributes from individual nodes.
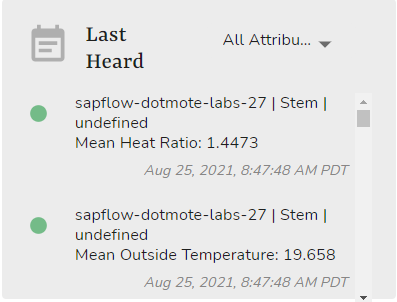
Information shown includes:
- Node ID
- Node location
- Plant location
- Attribute
- Last heard timestamp
Last Viewed
The Last Viewed widget provides thumbnails and shortcuts to your last viewed graphs. Click on any graph to be directed to a more detailed view of the graph.
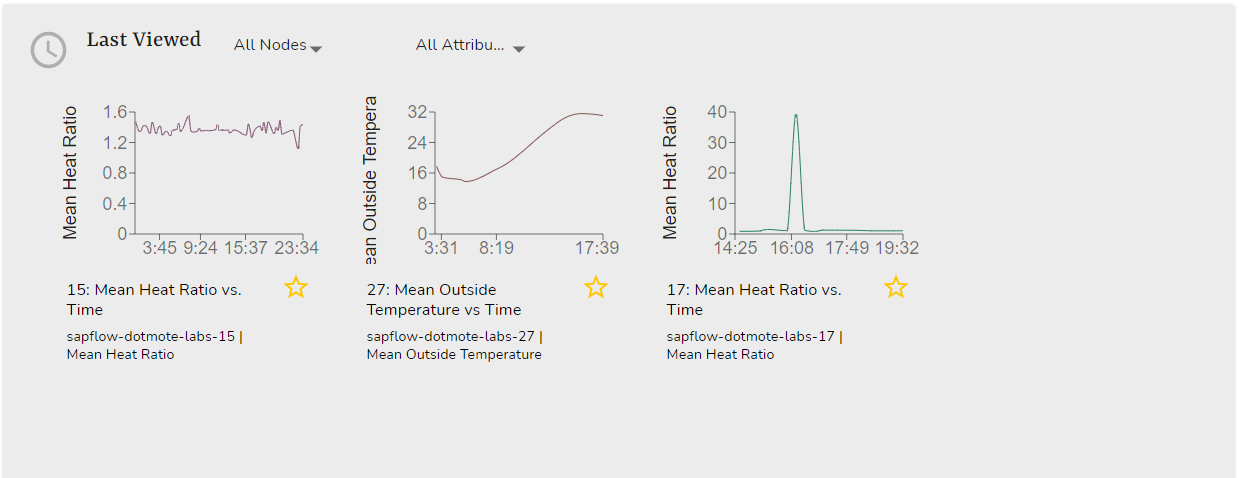
Information shown includes:
- Graph
- Graph title
- Node ids
- Attribute
- Favorite status