Graphs
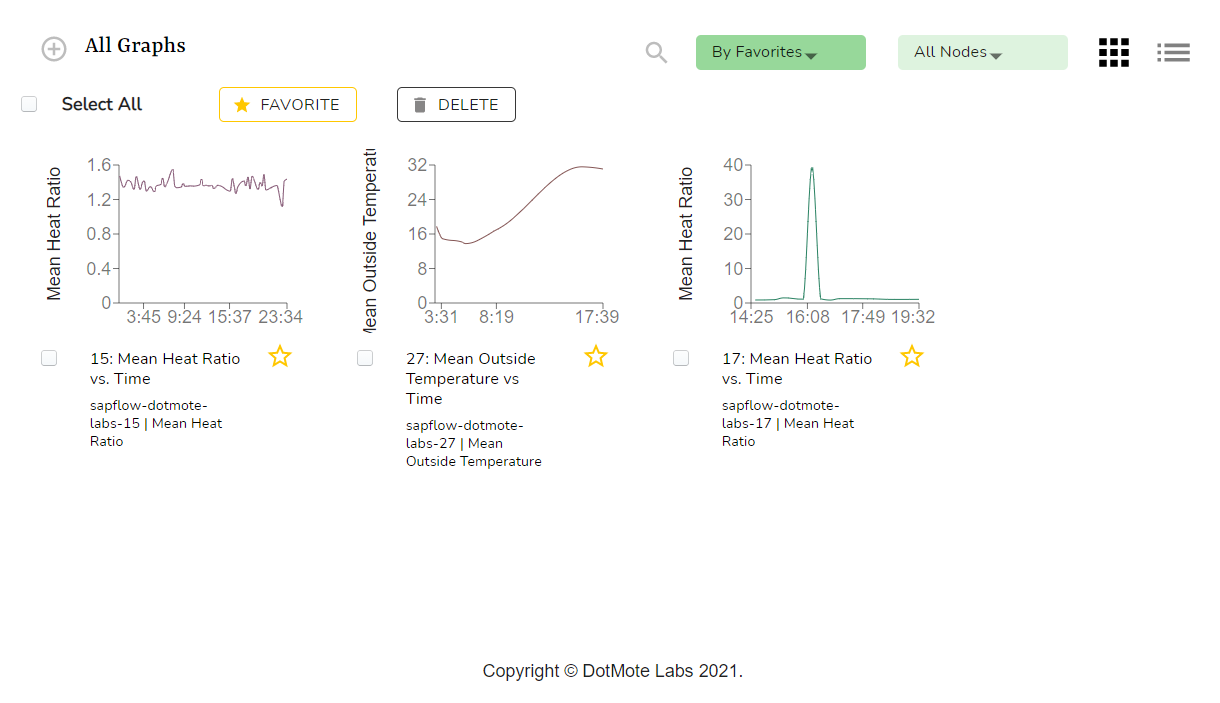
The Graphs page displays all of your graphs. Here, you can create, edit, and delete graphs.
Creating a Graph
To create a graph comparing a single attribute among multiple nodes:
From the Graphs page, click the
+near the top left corner of your screen. This popup will appear: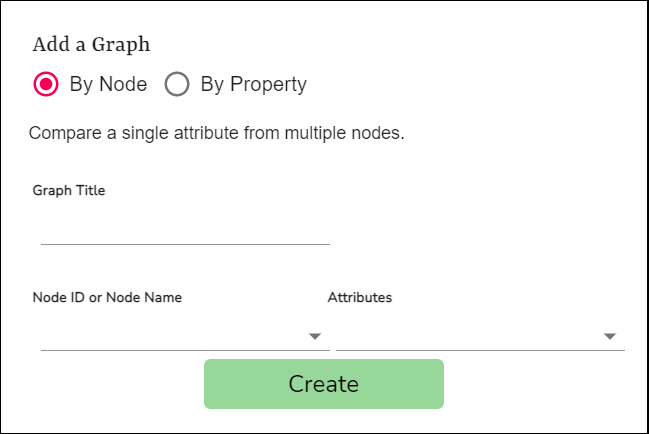
Select
By NodeunderAdd a Graph.Enter a
Graph Title.Select the node ids of the nodes you want to compare.
Select the node attribute you would like to compare.
Click
Create.
To create a graph comparing a single attribute among multiple nodes with the same properties:
From the Graphs page, click the
+near the top left corner of your screen.Select
By PropertyunderAdd a Graph.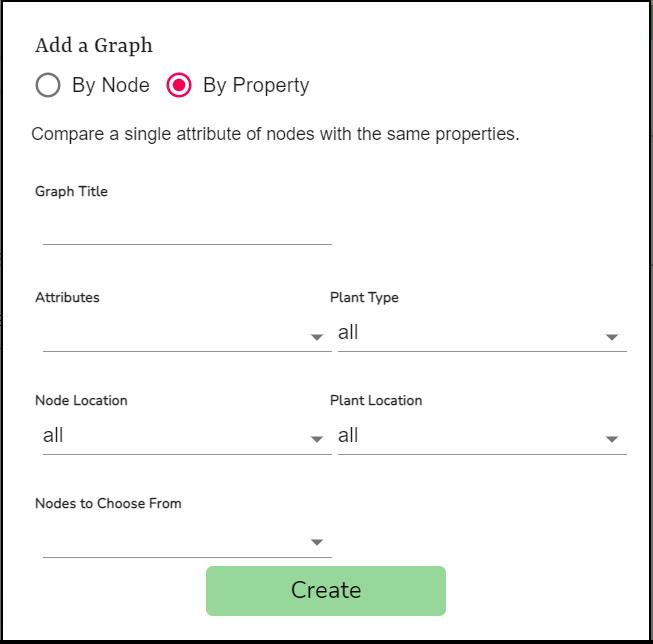
Enter a
Graph Title.Select the node attribute you would like to compare.
Select the
Plant Typeyou would like your nodes to have.Select the
Node Locationyou would like your nodes to have.Select the
Plant Locationyou would like your nodes to have.Select the node ids of the nodes you want to compare.
Click
Create.
A newly created graph will display 24 hours worth of data with graph lines of different colors. You are able to change these values by editing the graph.
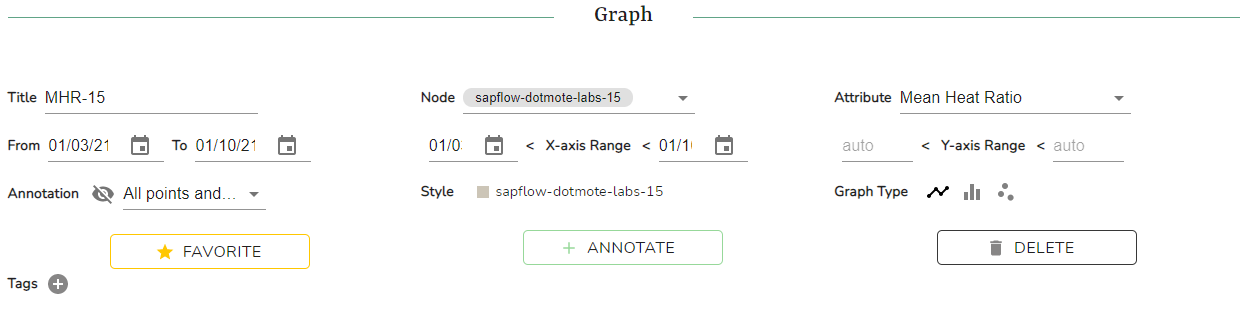
Editing a Graph
Click the graph you would like to edit. You will be redirected to a page that lets you to reconfigure your graph.
Features of this include:
- Favorite/unfavorite the graph
- Add annotations to the graph
- Delete the graph
- Modify specific properties of the graph
The following properties can be modified:
- Graph title
- Node(s) being compared
- Attribute(s) being compared
- Date range of the data
- X axis range
- Y axis range
- Annotations
- Graph colors
- Graph type
- Line graph
- Bar graph
- Scatter plot
- Tags
Annotating a Graph
Click the graph you would like to annotate. You will be redirected to a page that lets you to annotate your graph.
Click the
+ ANNOTATEbutton. This popup will appear: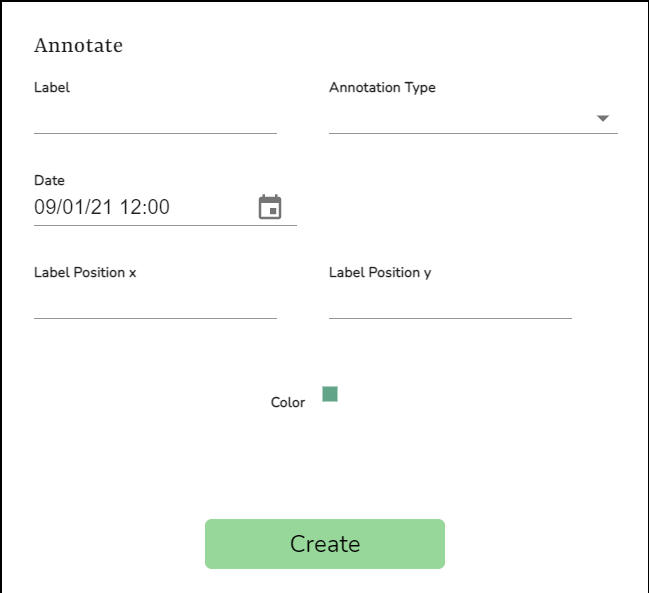
Enter the annotation label in the
Labelfield.Select your annotation type.
Select the date you would like your annotation on.
Enter the label position x value.
Enter the label position y value.
Graph Details
To view a particular graph in greater detail, click on the graph. You will be redirected to a page that will let you view a graph in greater detail as well as edit that graph.
The following details can be viewed:
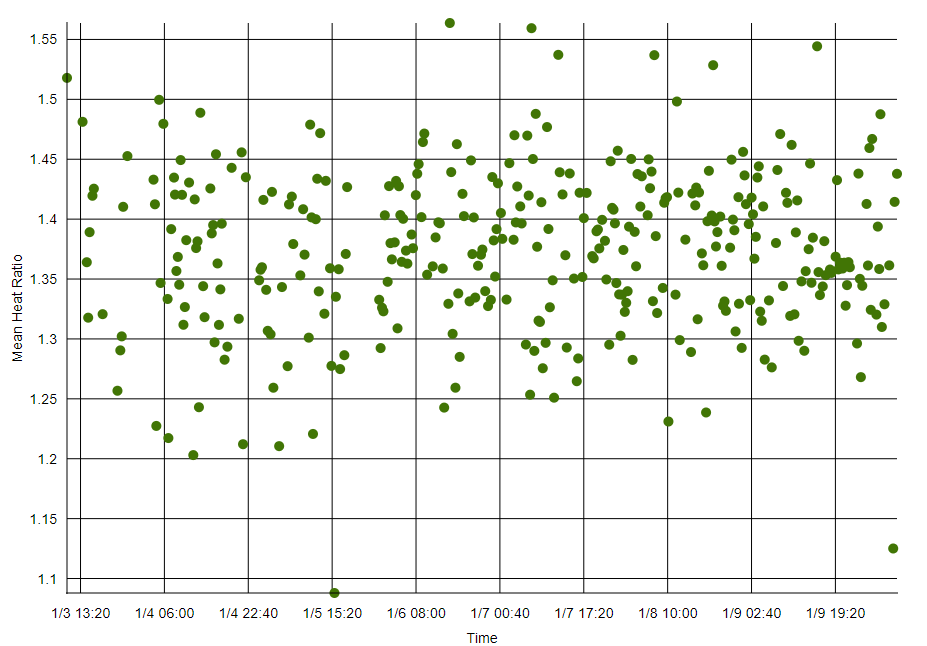
Graph
A bigger graph can be viewed and analyzed in greater detail.
Features of this include:
- Annotations display when graph is in range.
- Tooltips that display data when hovering over points.
- Dynamically updating graph fields and types.
Node Info
Node info of the node(s) being used is displayed.
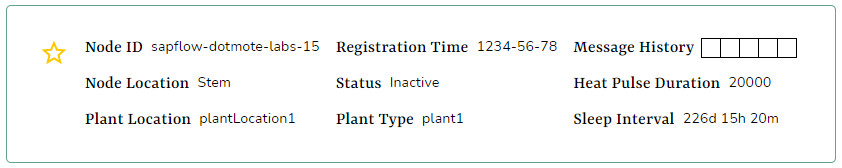
Information displayed includes:
- Node ID
- Registration time
- Message history
- Node location
- Plant location
- Plant Type
- Status
- Heat pulse duration
- Sleep interval
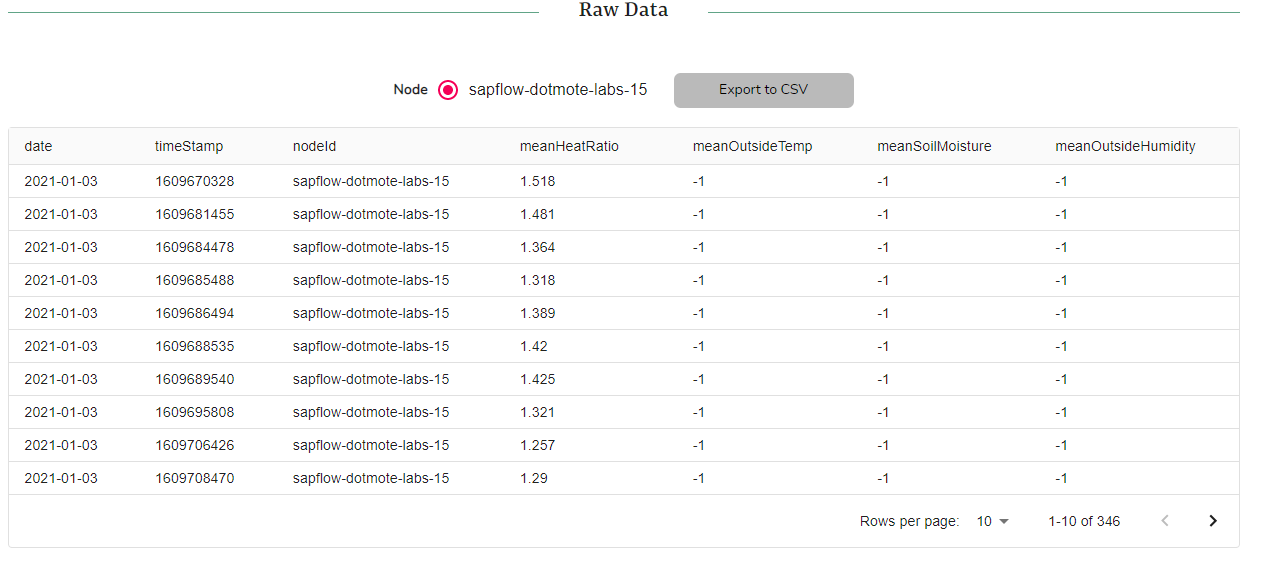
Raw Data
Raw data of the node(s)' sapflows is displayed.
Features of this include:
- Ability to switch between raw data of different nodes
- Export raw data to .csv
Information displayed includes:
- Date
- Timestamp
- Node ID
- Mean Heat Ratio
- Mean Outside Temperature
- Mean Soil Moisture
- Mean Outside Humidity
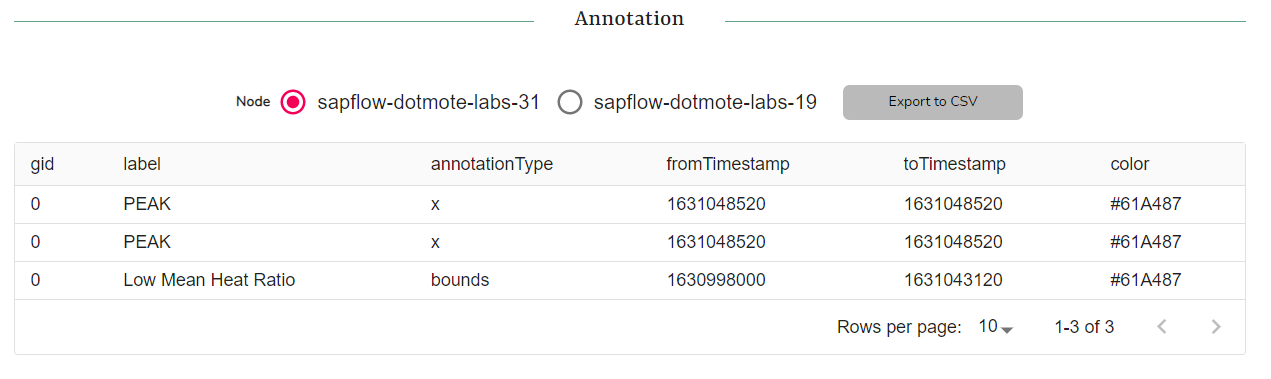
Annotations
Annotations made of the graph can be viewed.
Features of this include:
- Ability to switch between annotations of different nodes
- Export raw data to .csv
Information displayed includes:
- Graph id
- Label
- Annotation type
- From Timestamp
- To Timestamp
- Color
Edit History
If any property of the graph is changed, it will be documented in the edit history.
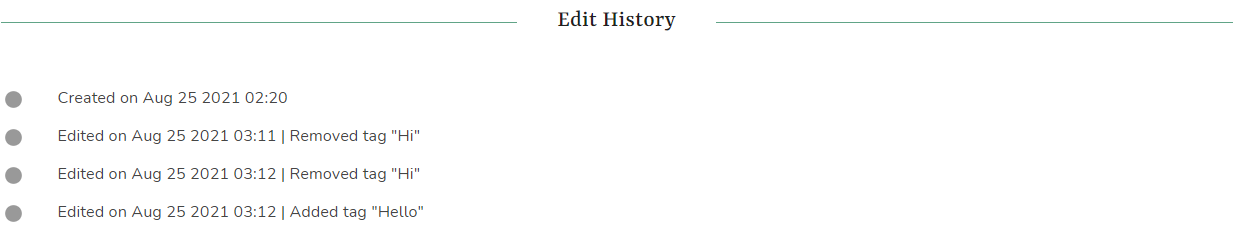
Information displayed includes:
- Created timestamp
- Edited timestamp with specific edit messages
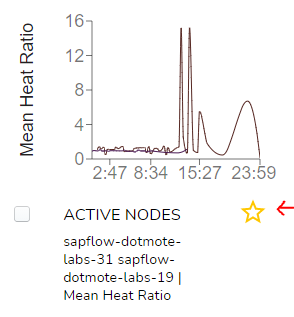
Favorite-ing a Graph
To favorite/un-favorite a graph, click the star icon next to the graph. Favorite graphs are indicated by a full yellow star icon.
Alternatively, you can click on the graph. You will be redirected to a page that lets you view your graph in greater detail. You can can on the Favorite Button from there.

Deleting a Graph
To delete a graph, select a graph on the graphs page and click on the Delete button next to the Select All.
![]()
Alternatively, you can click on the graph. You will be redirected to a page that lets you view your graph in greater detail. You can can on the Delete Button from there.